How do I see my inventory value over time?
0:14 · no soundSupporter
Supporters see a small curve beside the inventory total. It plots your value on each day you have a snapshot, so it needs snapshots from at least two different days, and you pick the range with 30D, 90D, 1Y or ALL.
Before you start
- A Supporter plan: How do I become a Supporter?
- An inventory snapshot: What is a snapshot, and why does my inventory say “Estimated”?
Step by step
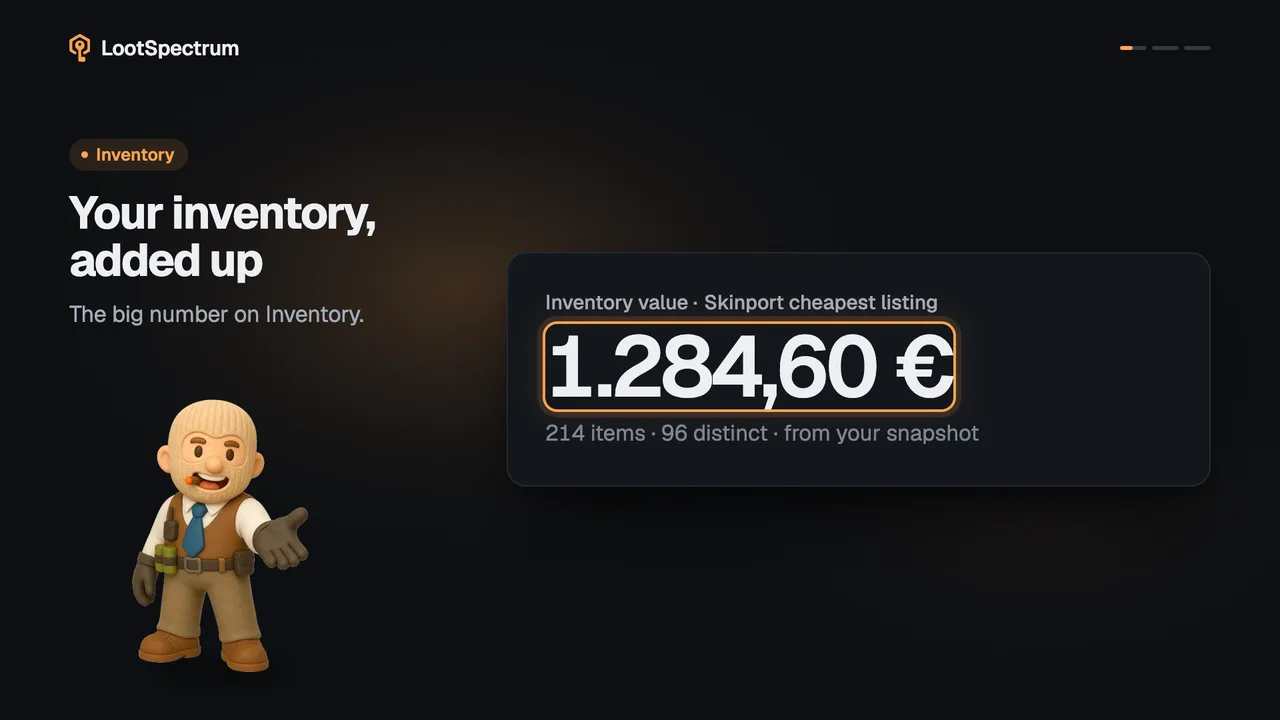
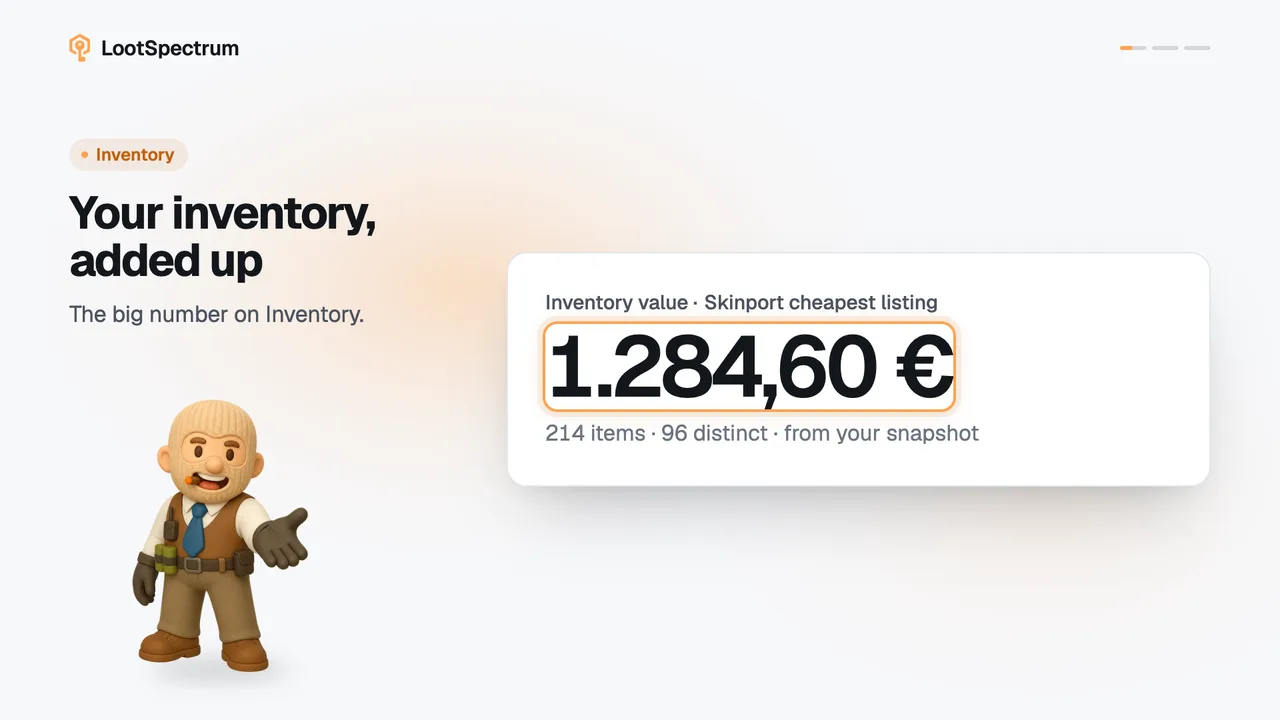
- Open Inventory as a Supporter; the block “Value, snapshots” sits beside the large total.
- Click “30D”, “90D”, “1Y” or “ALL” to choose how far back the curve reaches.
- Read the caption under the curve, for example “12 snapshot days”: the curve has one point for each of those days, priced at that day's prices.
- If the curve is missing and the caption reads “Needs snapshots from more than one day.”, take a snapshot on another day and the curve appears.
Good to know
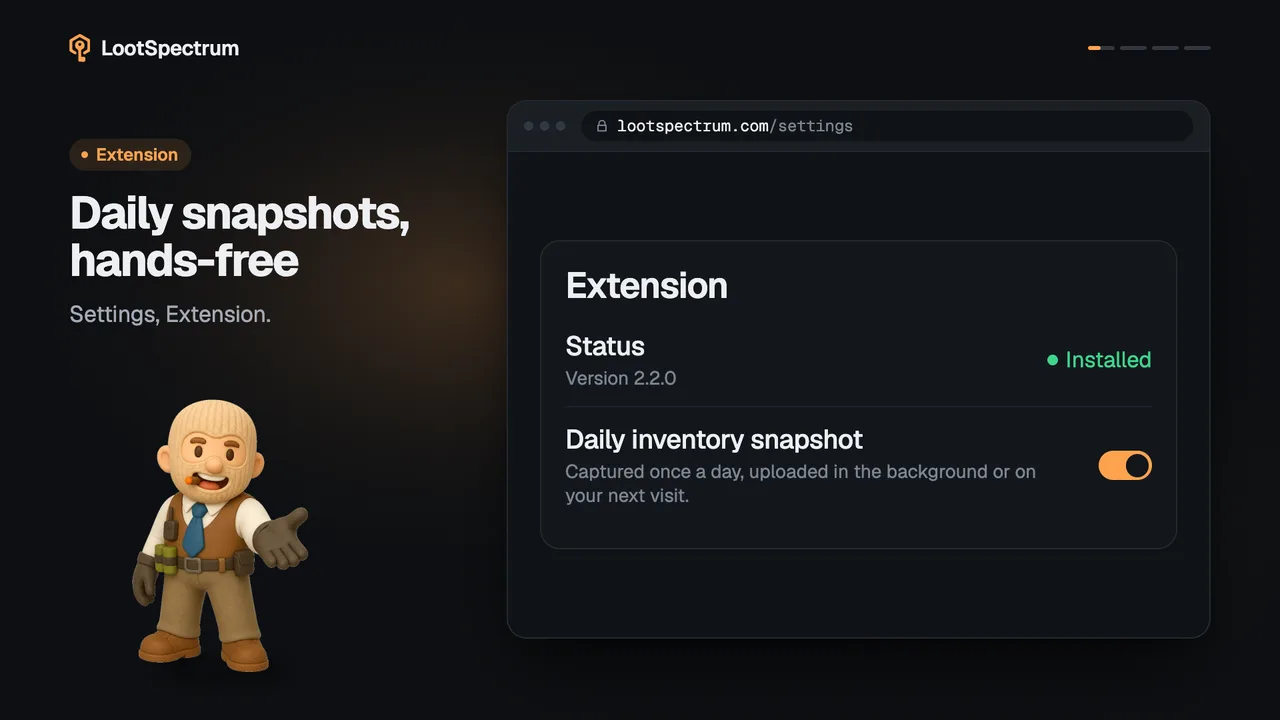
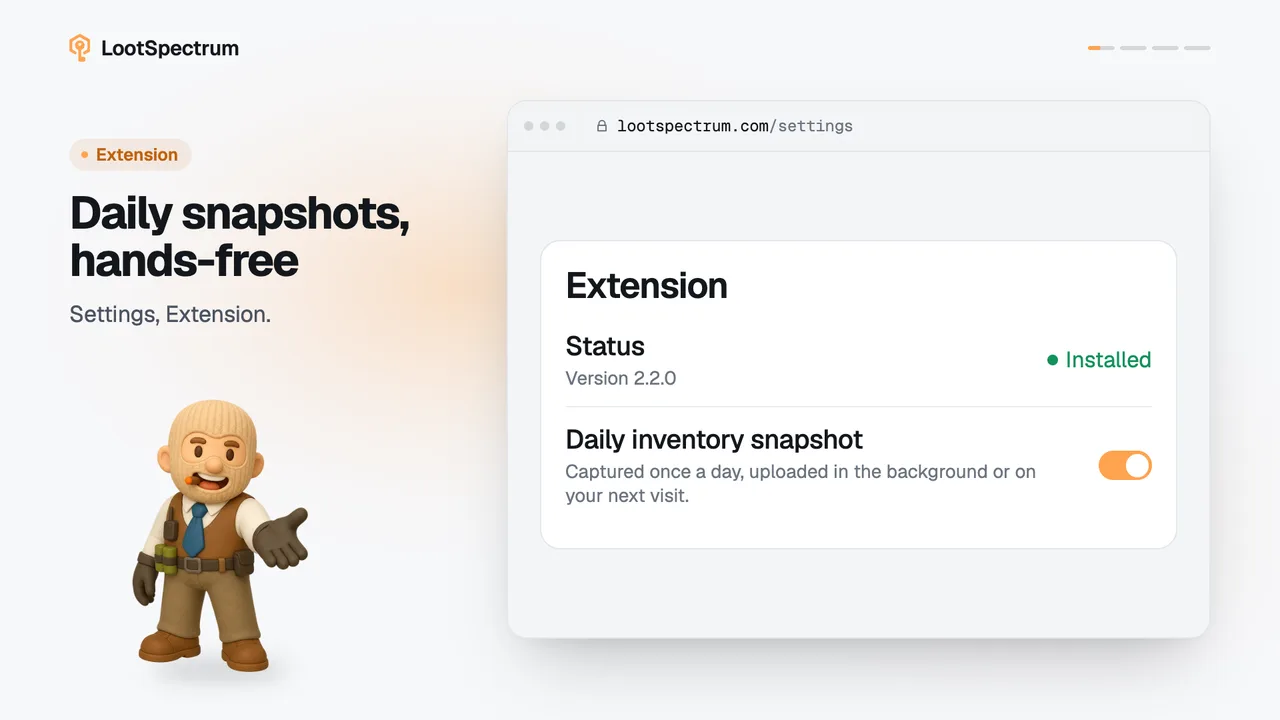
- A snapshot is taken by the extension once a day by default, or by hand from the Inventory banner or the Sync page; there is one per day, and a newer one replaces it.
- The curve is scaled to its own lowest and highest value, not to zero, so small moves stay visible.
- Beside the total, Supporters also see a change such as “+12,40 € · +1.0 % / 14d”; “14d” is the real span of your snapshots in the chosen range, not the name of the range.
- That change is hidden while a past “As of” date is chosen, because it would describe a different number than the one shown.
- An item with no price on a snapshot day counts as zero for that day.
- A free account does not see the block; a note under the total names inventory value, 30-day trends and value over time as Supporter figures.
Transcript
- 0:00Your value over time. For Supporters, beside the total.
- 0:03Pick a range. 30D, 90D, 1Y or ALL.
- 0:06One point per snapshot day. At that day's prices.
- 0:09Needs two snapshot days. Daily snapshots add them.