How do I read my trade-up results?
0:14 · no soundSupporter
Each trade-up contract is judged at today's prices, its output value against its input cost. Win rate is the share of contracts in profit, and every contract's own ROI is one click away.
Before you start
- A Supporter plan: How do I become a Supporter?
- Your history synced at least once: How do I run my first full sync?
Step by step
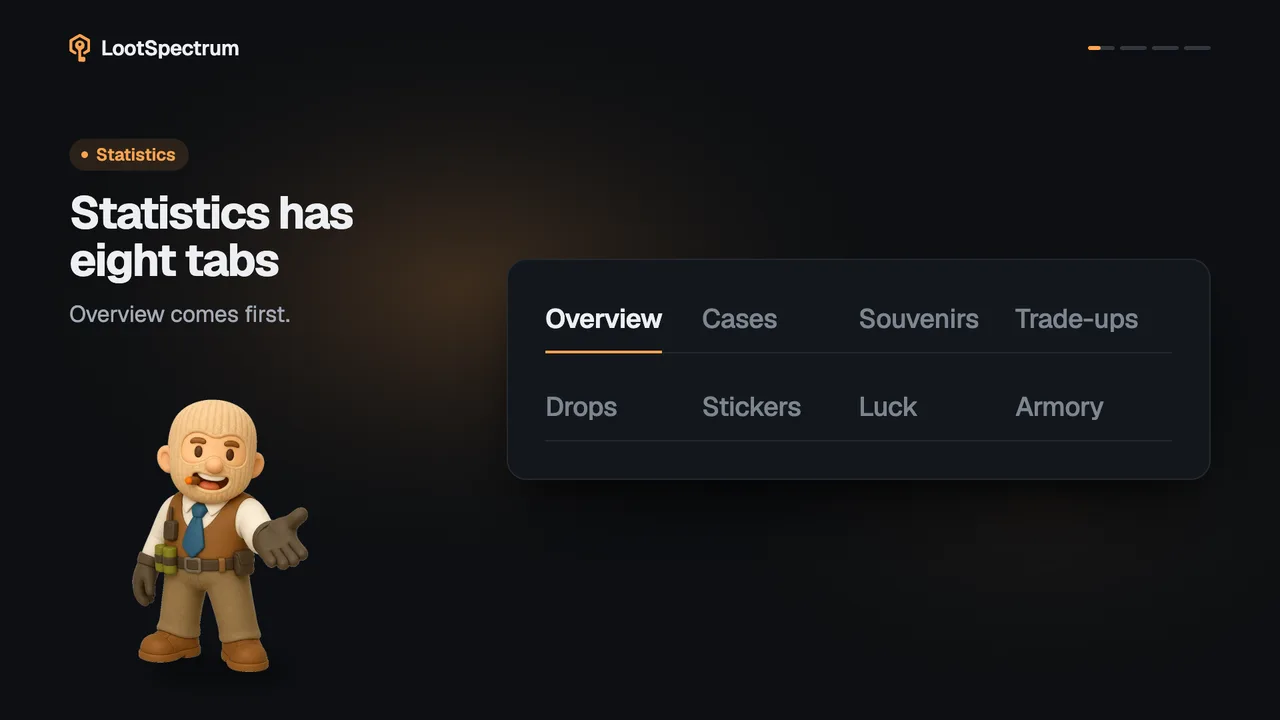
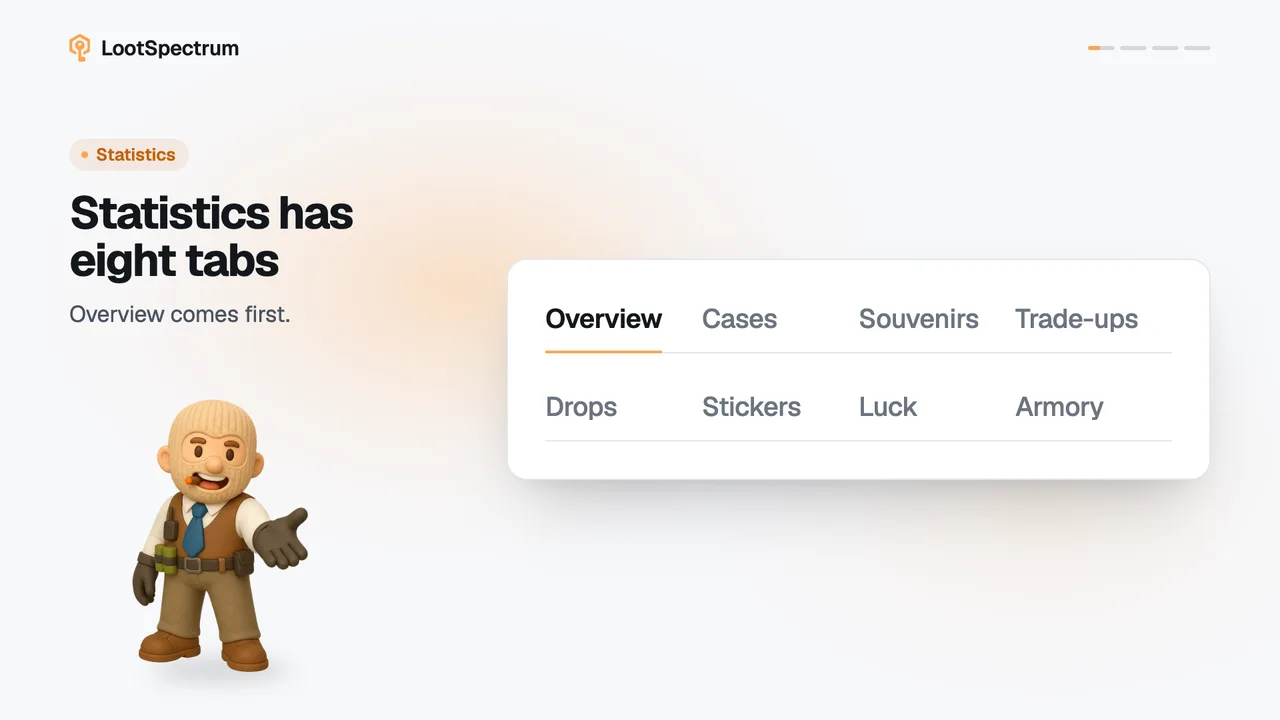
- Open Statistics and choose the Trade-ups tab; all figures in “Trade-up performance” use today's prices.
- Read “Win rate” as the share of your priced contracts whose output is worth more than their inputs.
- Read “Average profit” as the plain mean profit per contract.
- Check “Best trade-up” and “Worst trade-up”, ranked by profit at today's prices.
- In the History list, click a contract's “10 inputs” link to see “Inputs”, “Output” and “ROI” for that one contract.
Good to know
- Win rate is contracts in profit divided by priced contracts; it is not the share that gave a better rarity.
- Average profit is the plain mean per contract.
- The “Worst trade-up” row is hidden when the best and worst are the same contract.
- Below the rows are “Average return by input rarity” and “Most used collection”.
- “Return on spend” and “Profitable” in the “Then and now” table are totals, while “ROI” in a contract's detail is for that contract alone.
- Contracts whose output has no price are left out of Win rate and Average profit.
- A contract with an unpriced input looks cheaper than it was.
- Trade-ups are judged only at today's prices; there is no “at the time” view for them.
- The History list and its “N inputs” link also work on a free account, with prices locked.
Transcript
- 0:00Trade-up performance. All figures use today's prices.
- 0:03Win rate: contracts in profit. Output above input cost.
- 0:06Best and worst trade-up. Ranked by profit.
- 0:09Click “10 inputs” for ROI. Inputs, Output, ROI.